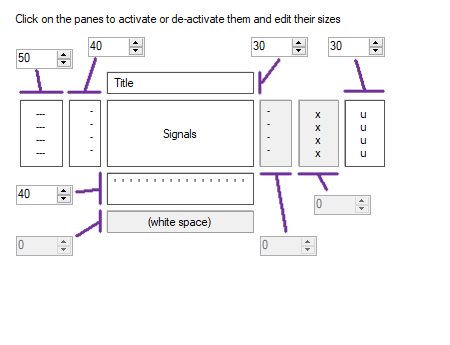
This viewer will show the input buffer or vector in a plot. Different layout options can be selected to change the layout of the viewer.
Symbol in the Object Toolbox
Operator ports
Input V: Specific sample type, see below.Paired User Interface Object
This operator is loaded simultaneously with a user interface object. The user interface object can be moved to another page, and would normally be displayed in the end-user application. The operator and this user interface object can never be separated. If you delete the operator, the user interface is deleted automatically as well. Note that you cannot delete the user interface, only the operator symbol!This viewer will only show the real part of an input vector.
User Interface Object on Printable Pages
The user interface of this component will be printed on a report, if it is put on a Printable Page (see "Page").Properties
Find more information about changing properties here: "Properties Viewer"GraphType
type: Select from the listDetermines how buffers and vectors are drawn
Select one of those presets:
bar
A filled bar graph
envelope
Un-filled bars
line
A line plot
scatter
A scatter plot
bar
A filled bar graph
envelope
Un-filled bars
line
A line plot
scatter
A scatter plot
TicksCountX
type: Integer valueNumber of grid ticks on the X axis
TickMultiplicationFactor
type: Real valueThe factor with which the tick values on the x axis will be multiplied.
TickOffset
type: Real valueThis value will be added to the tick values on the x axis.
BackgroundColor
type: Known color nameThe color of the background.
This property uses the Color Repository. For more information about the use of colors in a project, refer to "Color Repository"
ForegroundColor
type: Known color nameThe color of the title, axes and other lines around the graph.
This property uses the Color Repository. For more information about the use of colors in a project, refer to "Color Repository"
GridColor
type: Known color nameThe color of the grid or markings.
This property uses the Color Repository. For more information about the use of colors in a project, refer to "Color Repository"
SelectionColor
type: Known color nameThe color for channel selections.
This property uses the Color Repository. For more information about the use of colors in a project, refer to "Color Repository"
OuterBorderName
type: See descriptionSelect a style for the outer border of the viewer.
InnerBorderName
type: See descriptionSelect a style for the border of the panel where the viewer contents or graph is drawn.
Title
type: See descriptionThe title above the graph.
Y_Label
type: See descriptionThe label along the Y-axis.
Y_LabelVisible
type: True or FalseSet to False to disable the label along the Y-axis
Select one of those presets:
True or False
True may also be read like 'yes' and false like 'no'
True or False
True may also be read like 'yes' and false like 'no'
X_Label
type: See descriptionThe label along the X-axis.
X_LabelVisible
type: True or FalseSet to False to disable the label along the X-axis
Select one of those presets:
True or False
True may also be read like 'yes' and false like 'no'
True or False
True may also be read like 'yes' and false like 'no'
FontTitle
type: Known text font nameThe text font of the title (select from the Font repository).
This property uses the Font Repository. For more information about the use of text fonts in a project, refer to "Font Repository"
FontMetaData
type: Known text font nameThe text font of all meta data, such as channel names (select from the Font repository).
This property uses the Font Repository. For more information about the use of text fonts in a project, refer to "Font Repository"
FontContents
type: Known text font nameThe text font of values and labels of the shown contents or graph (select from the Font repository).
This property uses the Font Repository. For more information about the use of text fonts in a project, refer to "Font Repository"
SingleBaseline
type: True or FalseSet this value to 'true' if you want all the signals to be drawn around one baseline.
Select one of those presets:
True or False
True may also be read like 'yes' and false like 'no'
True or False
True may also be read like 'yes' and false like 'no'
ExtraRoomTopBottom
type: True or FalseIf true, a full baseline distance is added above the first channel and below the last; if false only half a baseline distance is added. If only one channel is visible, this setting may influence your Range/Offset settings.
Select one of those presets:
True or False
True may also be read like 'yes' and false like 'no'
True or False
True may also be read like 'yes' and false like 'no'
AllowChannelSelect
type: True or FalseIf true, the user is able to select channels by clicking one or more channel names.
Select one of those presets:
True or False
True may also be read like 'yes' and false like 'no'
True or False
True may also be read like 'yes' and false like 'no'
AllowZooming
type: True or FalseSet to true if the end-user is allowed to change the time range from within the viewer, by scrolling the scroll wheel of the mouse.
Select one of those presets:
True or False
True may also be read like 'yes' and false like 'no'
True or False
True may also be read like 'yes' and false like 'no'
NumberFormat
type: See descriptionDetermines how values are displayed in the viewer. Examples: ',2' (decimal comma), '.3' (decimal dot), ';1' (decimal comma or dot). This only regulates sample values, not time labels.
BackgroundImage
type: Known image nameThe name of the background image. The image name can be selected from the Image Repository (press the small button).
This property uses the Image Repository. For more information about the use of images in a project, refer to "Image Repository"
Caption
type: Word or phraseThe name of the object in the project. This name must not contain '.', '$' nor '@' characters.
For more information about the rules and usage of the Caption property, please refer to "Caption property - background and usage".
Documentation
type: See descriptionOptional documentation of this object. If this object is an operator, the Documentation text is displayed below the operator symbol.
Extra dialog to change properties of this object: Layout